
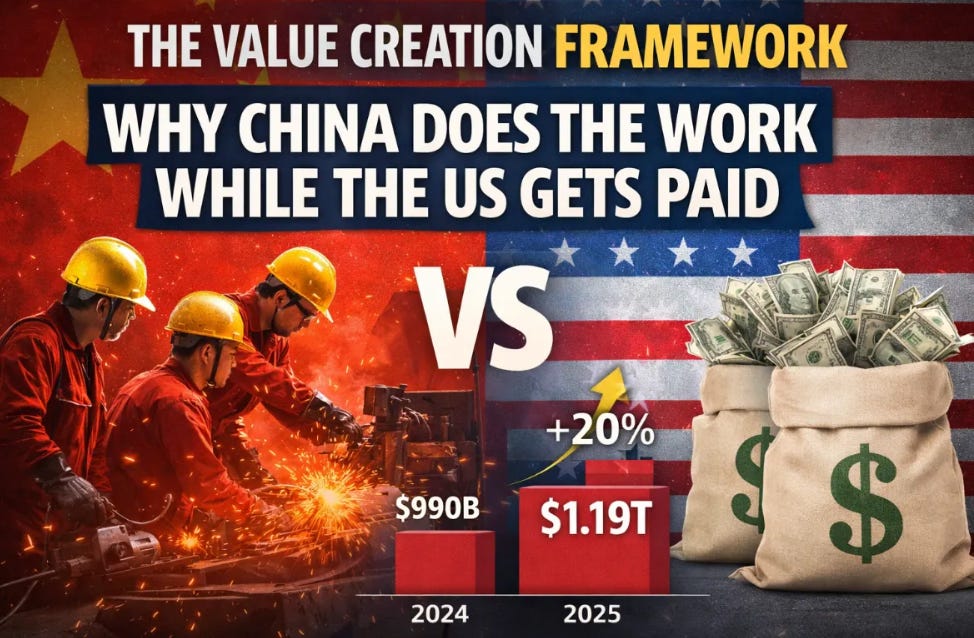
The Value Creation Framework
Why China does the work while the US gets paid

TLDR:
The Value Creation Framework separates three distinct drivers that are often conflated:
Value = Impact × Translation × Multiple
Impact is execution – how much real work gets done.
Translation is economics – how much of that work becomes surplus.
The multiple reflects trust – how far into the future others are willing to capitalise that surplus.
Different systems optimise different parts of this equation. China is maximising impact and reinvesting surplus to build capability and scale. The US is maximising multiples by owning choke points and concentrating trust in a small set of firms. The framework is universal: it applies to countries, companies, and individuals. Long-term value is created when execution, economics, and trust reinforce each other.
Folks following western media feel that China has recently had a difficult run. Property has stayed weak, confidence has taken longer to return, and the outside narrative is still stuck on slowdown and decoupling.
Against that backdrop, the headline number from 2025 lands with a thud: China recorded a $1.19T trade surplus — the largest surplus any country has ever reported — up from roughly $990B in 2024, nearly a 20% jump.
That is large enough to force a rethink. It sits awkwardly beside the mood music, and beside the way many people talk about China today.
This becomes easier to understand once you stop compressing three different things into one: real-world activity, economic surplus, and financial value. They overlap, and they often move together, but they behave differently and respond to different incentives. A system can do a lot of work in the real world and still be priced modestly in markets. A system can also be priced aggressively long before its full real-world impact shows up. Most confusion comes from treating them as the same thing.
The framework
The simplest way I’ve found to keep this straight is a three-part lens:
Value = Impact × Translation × Multiple
Impact: how much real activity happens.
Translation: how much of that turns into surplus.
Multiple: how the market prices that surplus.
These multiply rather than add. A weak link in any one of the three pulls the outcome down, even when the other two look strong. This is as true for countries as it is for companies.
Getting all three right over time is how compounding happens.
A 1X improvement in each leads to an 8X increase in value.
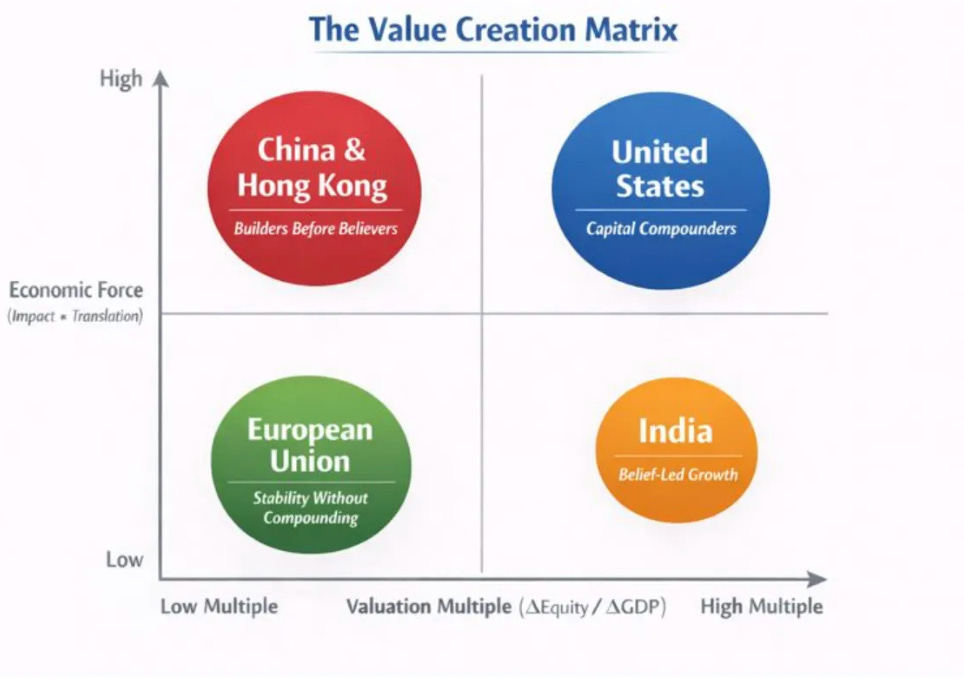
What this lens makes clear is that value outcomes are not linear and they are not intuitive. Two economies can generate similar levels of activity and end up with very different financial results because they sit in different places on these three dimensions. The matrix that follows simply makes this visible.
One axis shows economic force (the number from today) – impact multiplied by translation – and the other shows the multiple (driven by the story from tomorrow), which captures how far into the future markets are willing to capitalise that surplus.
‘Every market valuation is a number from today multiplied by a story about tomorrow’ - Morgan Housel
Where a country or company sits on the chart explains why it is being rewarded or discounted, without any judgement about whether the underlying system is “good” or “bad”. It also makes clear that this is not static. Movement on the grid over time – improving translation, building trust, or changing how surplus is captured – is what ultimately drives long-term value creation.
Impact
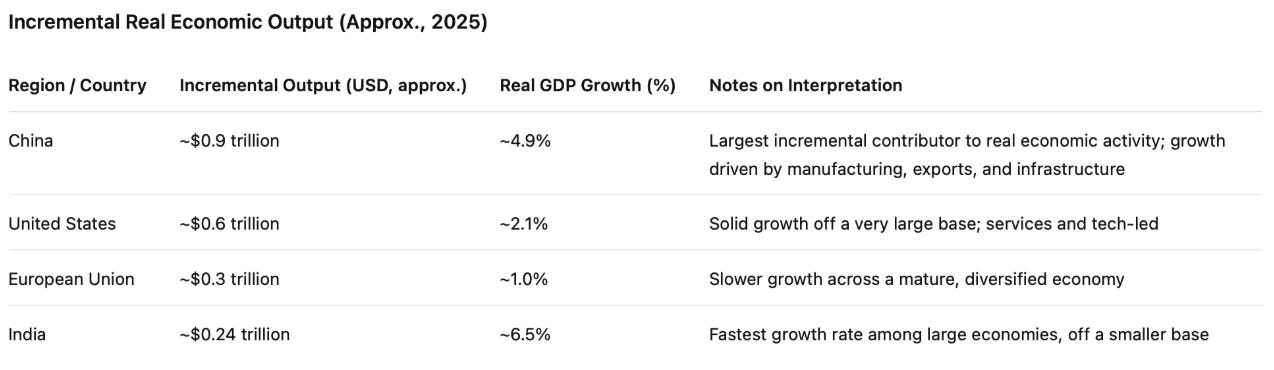
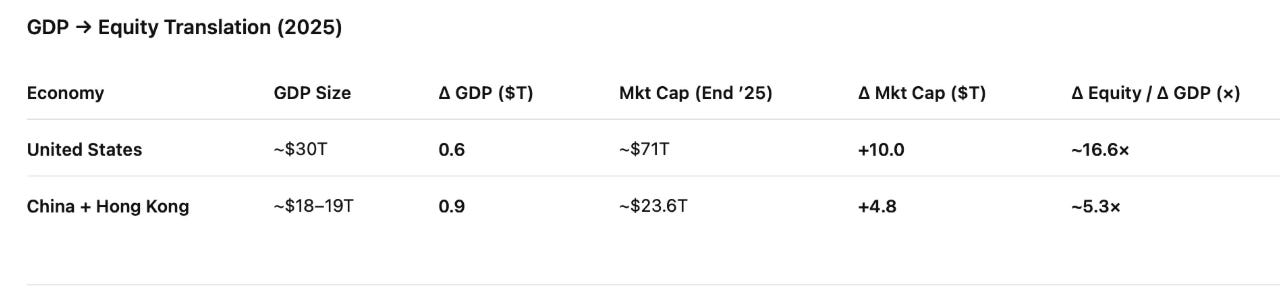
China was still the biggest incremental engine in the real economy in 2025. Roughly $0.9T of added output, versus about $0.6T for the US, $0.3T for the EU, and $0.24T for India. [approx numbers based on projections]
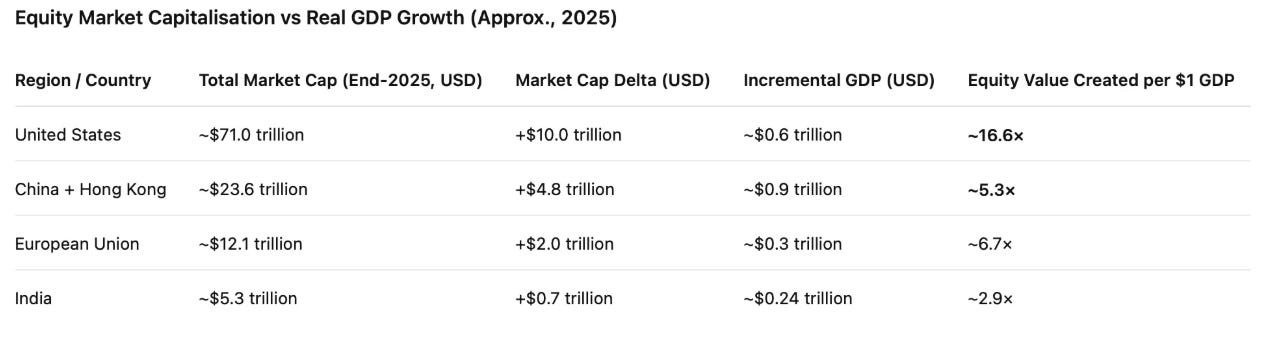
Now look at what equity markets did over the same year (year-end 2025 market cap). The US finished at $71.0T (+$10.0T). China + Hong Kong finished at $23.6T (+$4.8T). The EU finished at $12.1T (+$2.0T). India finished at $5.3T (+$0.7T).
Put bluntly: the US turned roughly $1 of GDP growth into ~$16.6 of equity value. China turned roughly $1 into ~$5.3. The gap is real and persistent.
That gap doesn’t require a story about who’s ‘right.’ It requires a description of how impact turns into surplus, and how surplus gets priced.
Translation
The ‘China is slowing’ story looks weaker once you see where the surplus is coming from. Some parts still carry friction - property and household sentiment. But other parts are compounding.
The trade engine is the easiest place to see it.
China absorbed a large, visible negative shock in exports to the US (–$95B)/-20%, but simultaneously expanded exports across ASEAN, Africa, the Middle East, Latin America, and Europe by +$180B, leaving a net export increase of +$85B.That is what “decoupling” looked like in the data..
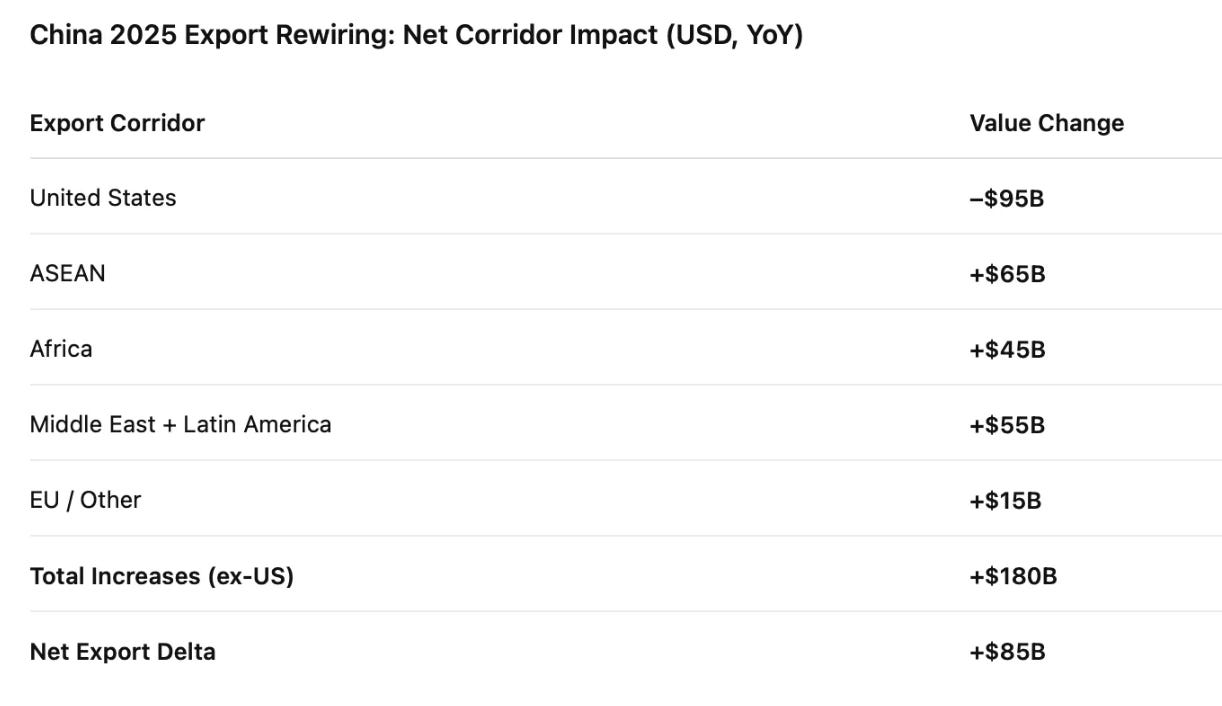
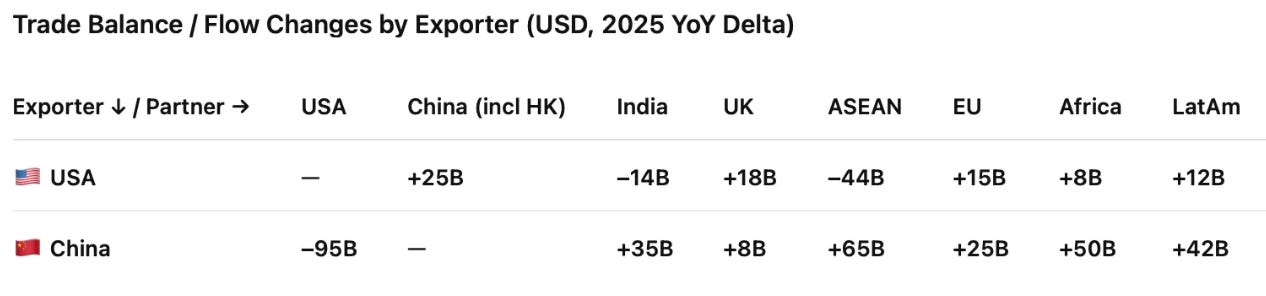
The trade balance makes the point even clearer. The surplus widened across multiple key markets, and China improved its balance with most major partners - by more, in aggregate, than the US did.
These are big numbers because they are structural, not cyclical.
China has become the default industrial partner of choice for a widening set of markets, especially where infrastructure build-out is still happening and price sensitivity is high. The US decline is real. It’s also a smaller share of the total story than it used to be. [For a deep dive down this rabbit hole, read my previous post on The China Struggle]
The product mix tells the deeper story of translation. The export categories that grew in 2025 skewed toward capital-dense, system-building goods. And at the same time, China reduced its share of low-priced consumer goods by pushing more of that manufacturing to other countries.
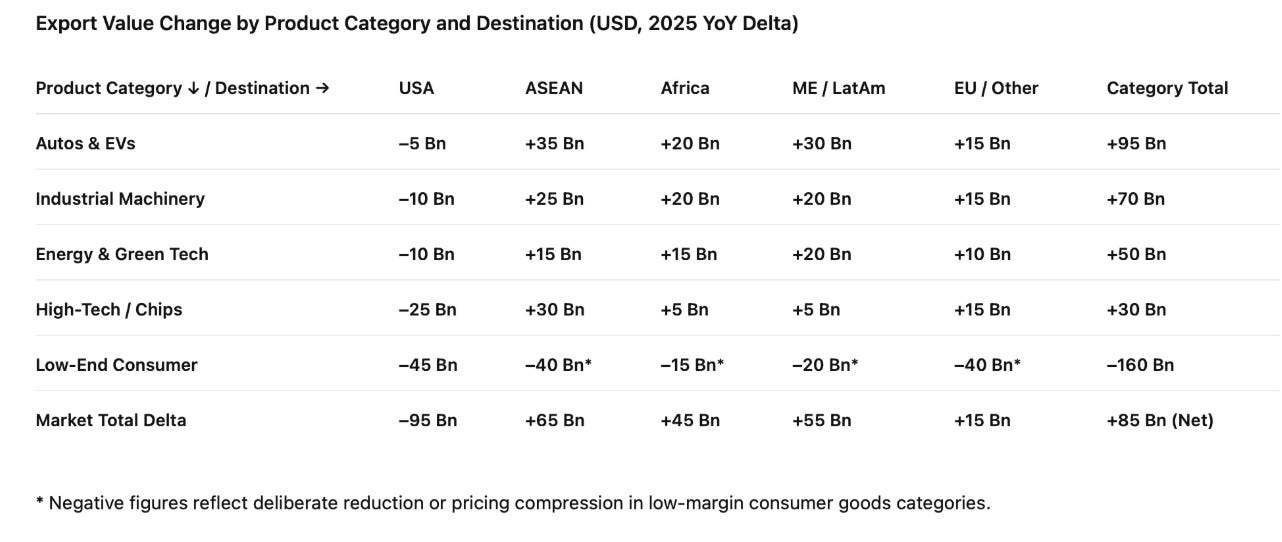
This shift isn’t a minor swing. It’s a re-weighting away from labour-intensive, low-margin categories and toward categories that sit closer to long-term industrial capability. This is what you would expect an innovative, hi tech superpower to export.
China is becoming the world leader in the key technologies of the future - in many cases aided by US withdrawal (Clean energy, battery technology, EVs are only a few examples)
EVs make it legible. China’s incremental exports in Autos & EVs alone (outside the US) more than offset the entire hit from lower US imports across categories.
China exported about 6.7M vehicles in 2025, including about 2.3M EVs and plug-in hybrids.
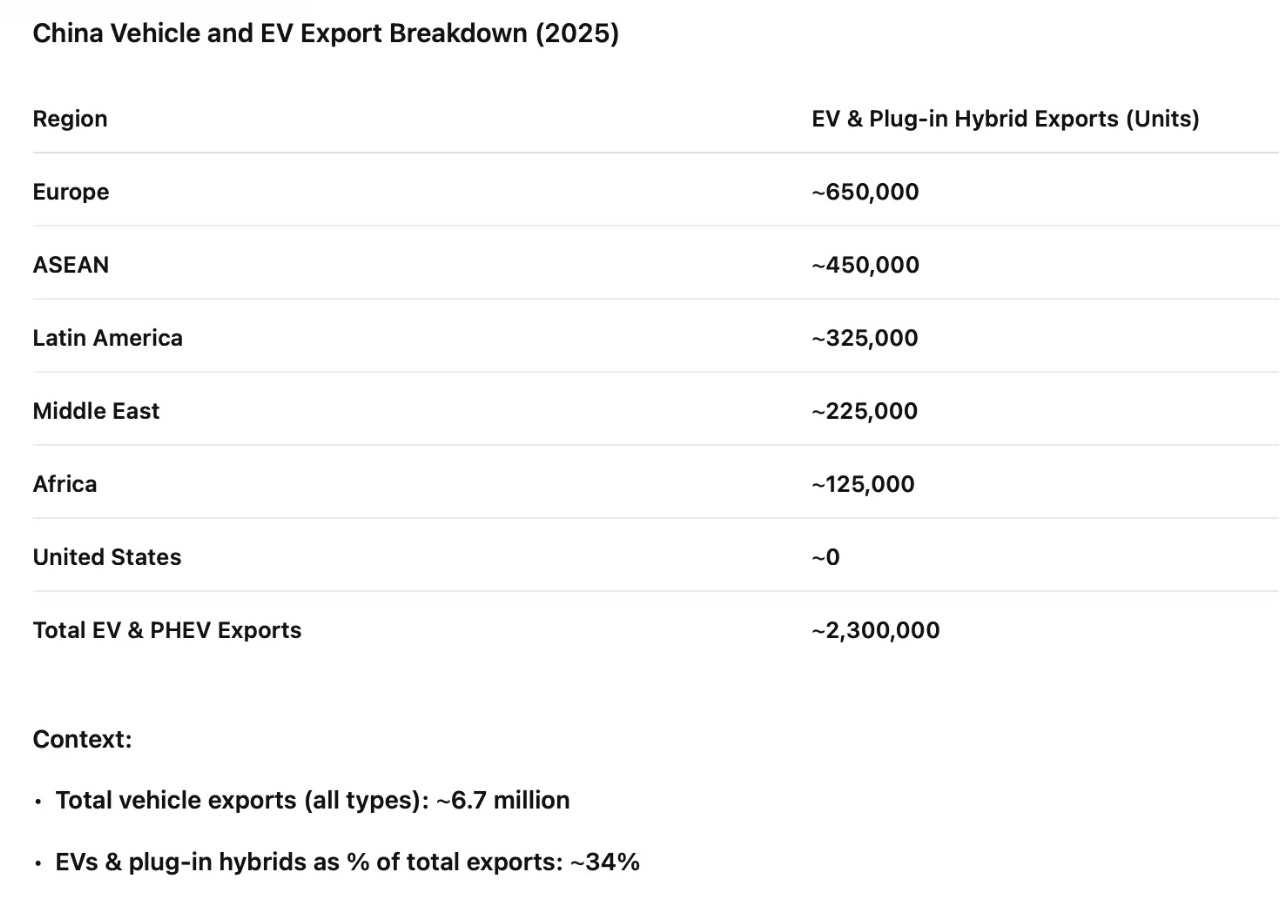
The exact split is less important than the shape: the export base is now broad, and the engine has routing options. ASEAN, LATAM and Africa + Middle East are all not that far from the volumes sold into Europe!
China isn’t just selling cars. It’s exporting an entire system – vehicles, batteries, charging hardware, grid equipment, financing, and service networks. That builds adoption and capability at scale, even if it keeps margins thin.
That makes the trade system more resilient. But it also keeps margins under pressure, because scaling fast across price-sensitive markets is a brutal game. The country gets capability. Shareholders get a smaller slice of surplus in the near term..
Now mirror the logic for the US, because symmetry keeps the analysis honest. The overall US trade deficit stayed very large in 2025, around $1.02T depending on the definition.
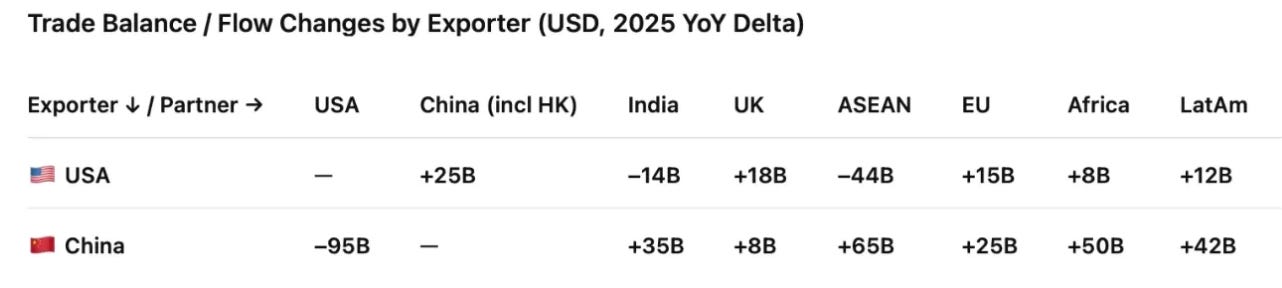
Within that, the US balance with China improved by about $25B as imports from China fell even more than exports to China. In the same year the combined balance with ASEAN and India worsened by $58B, which is the leakage effect: low end consumer goods moved through connector economies, aided by aggressive Chinese offloading and offshoring. The US surplus with the EU and the UK grew by about $33B, driven mainly by LNG, Oil and aerospace. That is a different kind of trade win. It sits in high scale, contract-backed lanes, and it converts into surplus more reliably than broad consumer goods import substitution.
Energy as a macro underwriter
The “subscription to Western stability” line deserves to be more than a metaphor. It is a description of contract structure and the way that structure feeds into discount rates.
US LNG exports into Europe are not primarily one-off spot trades. The backbone is long-dated contracting, often 10–20 years, dollar-linked pricing, and in many cases take-or-pay clauses. That creates committed volumes and more stable spreads than many commodity exposures. In valuation terms, this changes the distribution of macro outcomes. It reduces the frequency and severity of energy shock scenarios, it damps inflation volatility, and it reduces tail risks that would otherwise sit in the discount rate.
That matters most for long-duration assets, which is exactly what the big tech platforms are. When a large part of a company’s value sits far into the future, small changes in discount rates have outsized effects on present value. A world with more stable energy and fewer inflation spikes supports higher sustained multiples for companies whose value is driven by long-dated cash flows. This is why the energy corridor can matter a lot for equity markets without energy stocks being the main driver of equity gains.
Multiple and concentration: why value ends up where it does
China clearly created more absolute GDP than the US in 2025. It also exported more than the US, including in high-tech categories. On any simple measure of output, production, or physical economic contribution, China did more work.
So the obvious question follows: did investors in Chinese equities get rewarded proportionately to that growth, relative to the US?
Did Chinese investors get comparatively rewarded for the work done by their companies.
The answer is no.
In 2025, roughly 53% of total US equity market gains came from just ten companies. In China plus Hong Kong, the equivalent figure was closer to 29%, with the remainder spread across a much broader set of firms.
Those numbers describe concentration, but they don’t yet explain it.
Concentration is not an independent force. It is the visible outcome of sustained differences in valuation multiples, applied repeatedly over time.
When a small number of companies trade at materially higher multiples than the rest of the market, every incremental dollar of profit they generate adds disproportionately more market value than the same dollar generated elsewhere. If that condition persists year after year, the effect compounds. Market capitalisation drifts toward those firms even if growth exists across the system.
Once that divergence begins, it becomes path-dependent.
Index construction, passive flows, benchmark constraints, and risk models reinforce the outcome mechanically. As a company’s weight in an index rises, more capital is forced into it. That incremental capital reduces volatility, which supports higher multiples. Higher multiples then attract more discretionary capital, which further increases index weight. Over time, leadership becomes self-reinforcing.
Buybacks amplify the process further.
In the US, large technology firms have spent years converting operating cash flow into per-share value. As profits rise, share counts fall. Earnings per share grow faster than operating profit. Multiples are applied to a shrinking base. Market capitalisation accelerates again.
None of this requires heroic assumptions. It is arithmetic interacting with market structure.
This is why concentration is not a distortion and not a mystery. It is the footprint left behind when high multiples, buybacks, and index mechanics interact over long periods of time.
What still needs explaining is why the market is willing to keep applying those high multiples to the same set of companies, cycle after cycle — and why similar-looking businesses elsewhere do not receive the same treatment.
What allows these multiples to persist: trust
One lesson I’ve learned over time is that most companies are highly disciplined about managing the first two parts of the value chain, and far less deliberate about nurturing the third.
Inside organisations, almost all the focus sits on impact and translation.
Teams work relentlessly on driving sales, expanding market share, shipping more units, entering new markets, and building scale. Then they turn to margins, cost control, operating leverage, and cash conversion. All of that is necessary. None of it is optional. If a business is weak on impact or translation, there is no value to talk about.
But that is not where the disproportionate reward comes from.
The disproportionate reward, especially in public markets, shows up in the multiple.
And the multiple is not driven by last quarter’s numbers. It is driven by trust that the company will deliver financial performance consistently over a very long period of time.
This is where the Value Translation Framework links directly to the Trust Framework. The multiple is not a mysterious market artefact. It is the market’s shorthand for a judgement about trust.
In practice, that trust rests on three things.
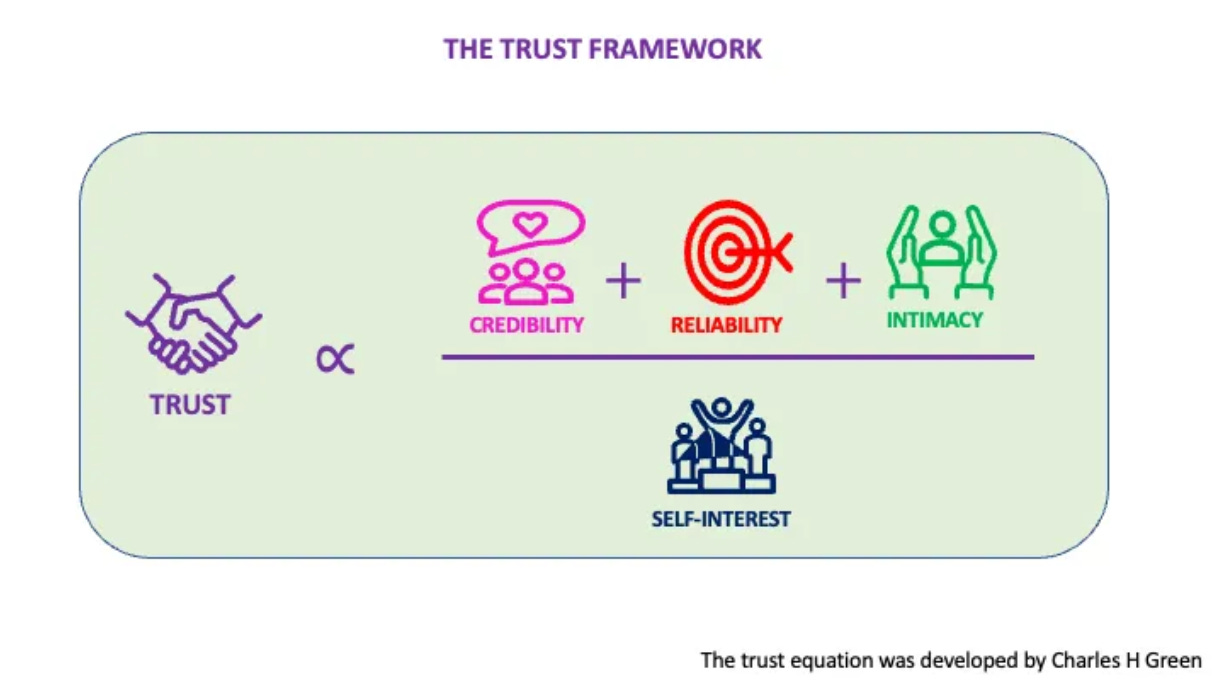
The first is credibility and intimacy.
Does the company set sensible targets, and does it meet them? Markets place more weight on consistency than on ambition. Companies that repeatedly say what they will do and then do it earn the right to be extrapolated. Companies that over-promise, even if they occasionally outperform, teach the market to discount them.
The second is reliability.
This is about behaviour over time and across conditions. Can the company deliver through cycles, shocks, and uncertainty? Reliability is what allows investors to project today’s cash flows forward without constantly haircutting them. Without it, even strong current performance is treated as fragile.
The third is low self-interest, and this is the dimension most leadership teams underestimate.
Investors watch governance closely. They watch how capital is allocated, how incentives are structured, how management behaves when trade-offs appear, and whether decisions consistently favour long-term shareholder and stakeholder outcomes rather than short-term managerial gain.
Companies that are seen to do the right thing when it costs something build a deep reservoir of trust. Companies that don’t eventually see that trust erode, regardless of how attractive the numbers look.
Taken together, these three dimensions are what the market is really pricing when it assigns a multiple.
The multiple is not just a valuation ratio. It is a statement about how far into the future the market is willing to believe.
This is why two companies with similar growth rates and similar margins can trade at very different valuations for long periods of time. One has earned trust across credibility, reliability, and low self-interest. The other has not.
Seen through this lens, the framework becomes a practical diagnostic rather than an abstract explanation. The key question shifts to where value is leaking.
Is impact strong but translation weak because pricing power or cost structure is the constraint?
Is translation strong but the multiple capped because the market does not trust durability?
Or is the underlying business sound, but governance, capital allocation, or communication are undermining belief?
Pricing power, cost structure, capital intensity, buybacks, concentration, and narrative consistency all sit in different parts of the chain. A CEO’s job is not simply to push harder on growth or squeeze margins, but to understand which lever actually moves value at the margin at that moment in time.
Most leadership teams are trained to manage impact and translation. Far fewer are trained to manage trust deliberately. Yet in public markets, trust is often the difference between a good business and a great investment.
Why this trust dynamic penalises Chinese multiples — by design
This trust lens also explains a large part of the persistent multiple gap between US and Chinese companies, including in technology.
Many Chinese companies are credible. Many are reliable. Many execute extremely well. The gap is not capability.
The difference lies in how value is intentionally distributed.
In China’s system, value created by firms is expected to serve a wider set of stakeholders: consumers, workers, suppliers, local governments, and national priorities. Price competition has historically been tolerated - and often encouraged - as a way of accelerating adoption, lowering costs, and building industrial depth.
This is where the concept of “involution” (内卷) matters.
For a long period, Chinese firms competed in ways that destroyed margins without creating incremental capability. That was recognised as a problem. Over the last 18–24 months, policy has shifted toward discouraging irrational price wars, encouraging consolidation, and emphasising quality, standards, and technological depth.
But that shift is recent, and the legacy of involution still shapes how markets view Chinese firms.
From an investor’s perspective, the concern is not that profits will not be made. It is that surplus capture is less predictable.
When value is routinely passed through to consumers via lower prices, reinvested into capacity, or absorbed into broader system objectives, the horizon over which equity cash flows can be confidently capitalised shortens.
In Trust Framework terms, many global investors struggle less with credibility and reliability in Chinese companies than with low self-interest, as they define it.
The concern is not malfeasance. It is uncertainty about how consistently minority shareholder interests will be prioritised when they conflict with system-level objectives.
That uncertainty caps multiples even when operating performance converges.
This does not mean Chinese companies cannot earn higher valuations. It means they face a higher bar. They must demonstrate not just performance, but alignment, transparency, and capital discipline over long periods of time, across changing policy and geopolitical conditions.
In addition, multiples are not helped by the increasing media noise and social chatter in the west in creating an us-vs them, decoupling narrative,
That is why the multiple gap persists even when growth rates, margins, and technology leadership converge.
The company lens: the same framework in miniature
At company level, the same logic becomes even clearer.
Impact is revenue growth and units shipped.
Translation is conversion into EBITDA and cash.
The multiple reflects trust and the expected durability of surplus capture.
Nvidia makes the logic painfully legible.
Over the period discussed, Nvidia’s revenue increased by about $40–45B. Over the same period, its market capitalisation increased by roughly $1.5–2.0T.
That is an extraordinary conversion. Every $1 of revenue drove $16 in market value.
Translation is strong because Nvidia sits at a scarcity choke point, with pricing power, capital-light economics, and operating leverage. Capture is extreme because a large share of global AI value accrues to it before value reaches downstream users.
Markets can see that chain clearly, and they capitalise it far into the future.
BYD is the counterexample, not because it underperforms, but because it performs a different role.
BYD sold about 3M vehicles in 2025. Revenue increased by roughly $25–30B. Real-world impact was enormous: transport electrified, costs lowered, capacity built across China, ASEAN, Latin America, the Middle East, and Africa.
But BYD’s market capitalisation increased by only $80–120B. 1$ revenue drove only $4 in value
That gap is not a failure of impact. It reflects translation economics shaped by intense price competition, reinvestment into capacity, and the role the company plays in building system capability rather than extracting rents.It does not adequately consider the long term profit pool and the higher share that BYD will eventually capture of the global auto profit pool because of scale.
Value is created and used widely before it ever concentrates in equity value.
That is not inefficiency. It is design.
Value creation versus value recognition
China creates a lot of value that is used before it is priced. Roads, power systems, industrial ecosystems, EV fleets, charging networks, manufacturing capability, logistics reliability, and learning curves show up in daily life and national capability long before markets fully recognise them. The real-world value arrives early. Recognition is often delayed.
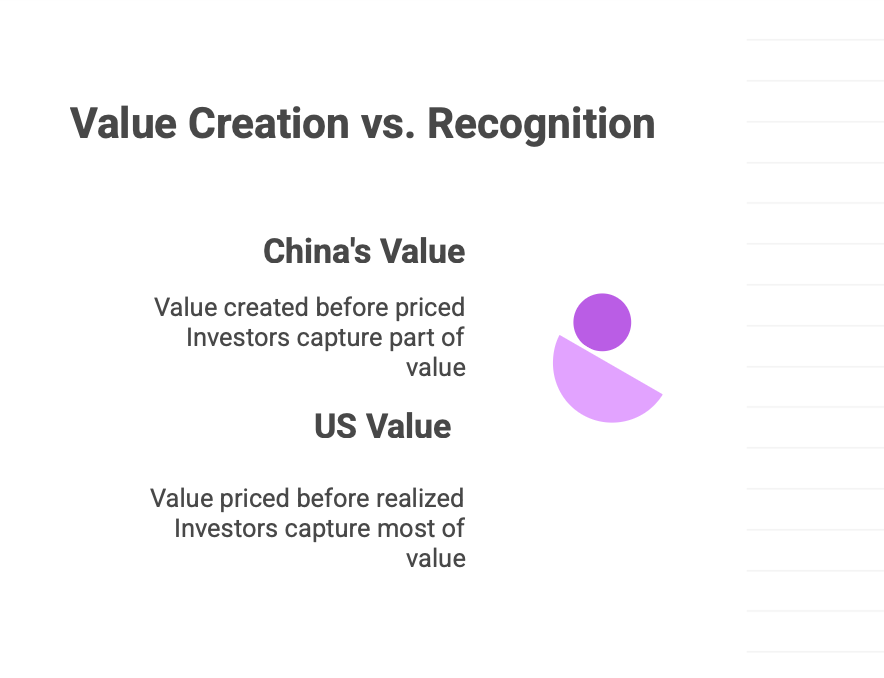
The US often prices value before it is fully realised. Expectations about future dominance, future margins, and future optionality are capitalised early. Sometimes that future is delivered, sometimes it takes longer, sometimes it changes shape, and sometimes it proves fragile. The ordering still matters. One system builds, then gets priced. The other system gets priced, then builds.
Using the framework as a diagnostic
Companies:
Where I’ve found this framework most useful is as a diagnostic for CEOs, because it surfaces a gap that many leadership teams sense but don’t always name.
Most companies are already quite good at managing the first two parts of the chain. Impact shows up in sales growth, units shipped, customers added, and market share. Translation shows up in margins, cost discipline, operating leverage, and cash conversion. This is where operating reviews focus and where incentive plans are built. And it should be. If you’re not growing, or if growth doesn’t convert into profit and cash, there’s nothing to value.
But that still isn’t where the real payoff comes from.
The real payoff shows up in the multiple. And the multiple is not driven by last quarter’s numbers. It reflects whether the market believes the business can deliver financial performance consistently and defensibly over a long period of time.
The arithmetic makes this clear. A business earning £100m of sustainable annual profit on a multiple of 10 is worth £1bn. If nothing changes operationally, but the market becomes willing to value that same profit stream on a multiple of 11, the valuation rises to £1.1bn. One extra turn on the multiple has created £100m of value — roughly a full year of profit — without selling a single extra unit. In many capital-light businesses, a one-point move in the multiple can be worth five to ten times annual profit.
Seen this way, the diagnostic question becomes practical: where is value leaking?
Sometimes impact is strong but translation is weak because pricing power or cost structure is the constraint. Sometimes translation is strong but the multiple is capped because investors don’t trust how durable those profits are. And sometimes the business is sound, but capital allocation, governance, or communication quietly undermine belief. Running the business well mostly moves the first two. Being rewarded for it depends on the third.
The multiple rises when investors trust that the company will do what it says, do it repeatedly, and do it in a way that aligns management behaviour with long-term shareholder and stakeholder outcomes. Credibility, reliability, and low self-interest are not abstract virtues here; they determine how far into the future the market is willing to extrapolate today’s profits.
Running the business well gets you profit.
Earning trust determines how many times that profit is worth.
Governments:
A government can use it to make trade-offs explicit. Policies that maximise impact and capability often suppress translation in the short term. Policies that protect margins and capital returns can lift translation and multiples, at the cost of diffusion and affordability. The framework helps policy-makers choose which lever to bias at which stage of development, instead of pretending all objectives can be maximised simultaneously.
Investors:
An investor can use it to decide what kind of exposure they are buying. Some assets maximise impact but rely on changes in translation and multiple over time. Others maximise current translation and multiple but depend on discount rates and belief. Framing it this way turns asset allocation into a structured choice rather than a narrative fight.
In closing
Separating impact, translation, and the multiple forces you to be honest about where value is actually flowing, and where it’s simply being priced.
Once you see it that way, debates about whether China or the US is “winning” start to feel beside the point. What matters is understanding which system you’re operating in, which lever it prioritises, and whether the gap between use and recognition is widening or narrowing over time.
When I look at this through my own lens, what stands out is how intentional both systems are.
China’s system does what it is designed to do. It compounds scale, networks, and physical systems, and it deliberately reinvests surplus to build capability in industries that matter next. Value shows up first in use: in cheaper transport, more reliable logistics, denser supply chains, and faster learning curves. Financial recognition comes later, if at all, and only once capability is secure.
America’s system also does what it is designed to do. It prices the future early. It applies high multiples to long-duration cash flows, and then reinforces those valuations through buybacks, index mechanics, and a market structure built to convert operating success into per-share value as quickly as possible. Value shows up first in market capitalisation, often well before the full real-world impact is visible.
Neither approach feels accidental to me. They reflect different answers to the same underlying question: where should surplus go, and when?
One system pushes surplus back into the real economy to strengthen position and resilience. The other pulls surplus forward into financial markets to compound capital. The outcomes look very different on a screen, but they are coherent once you follow the chain.
That’s why I’m comfortable holding two ideas at the same time: that China is doing an extraordinary amount of real work in the world, and that the US is extraordinarily good at getting paid for the work it chooses to recognise early. The tension between those two is not a contradiction. It’s the point.
Footnotes, definitions, and scope
1. Market capitalisation figures
All market capitalisation figures cited in this article (for example, US ~$71.0T with a ~$10.0T year-on-year increase; China + Hong Kong ~$23.6T with a ~$4.8T increase; EU ~$12.1T with a ~$2.0T increase; India ~$5.3T with a ~$0.7T increase) are end-of-year 2025 approximations based on aggregated exchange-level and index-level data.
These figures are not intended to represent a single canonical series. Reasonable alternative definitions — such as Wilshire 5000 vs MSCI USA for the US, exchange-level totals vs index aggregates, different treatments of cross-listed securities, or FX conversion at spot vs average rates — will produce modest variations. None of those variations change the central observation: the US added materially more equity value than China+Hong Kong in 2025, and that value was far more concentrated.
2. Market-cap concentration (top-ten contribution)
Statements such as “approximately 53% of US equity gains came from the top ten companies” and “approximately 29% in China+Hong Kong” refer to estimated contribution to total market-cap change by the ten largest contributors within the relevant market universe.
The exact percentage varies depending on:
index or universe definition,
start and end dates,
FX treatment,
and whether the ranking is by absolute contribution or end-period size.
The argument does not rely on any specific percentage being exact. It relies on the robust pattern that US equity value creation in 2025 was heavily concentrated in a very small number of firms, while China’s was more broadly distributed.
3. Trade flows and surplus by region
Trade and surplus figures are drawn from China Customs Administration releases for calendar year 2025, supplemented by standard trade aggregations. Regional figures (ASEAN, Africa, EU, Middle East, Latin America, India) are groupings rather than individual bilateral claims.
As with all trade data, figures vary depending on:
FOB vs CIF treatment,
re-exports and trans-shipment,
exact country inclusion in regional groupings.
The analysis depends on direction, scale, and simultaneity rather than bilateral precision: a large decline in US-bound exports, offset by large increases across multiple other regions, resulting in a record overall surplus.
4. “Incremental real GDP in USD terms”
The phrase “incremental real GDP in USD terms” is used as a comparative heuristic, not a strict accounting construct. It refers to estimated year-on-year real GDP growth in local currency, translated into USD using average annual exchange rates for ease of comparison across countries.
This approach is acknowledged as imperfect. Its purpose is to convey relative scale — that China added more real economic output in 2025 than the US — not to produce a precise decomposition. The structural argument holds under alternative reasonable treatments.
5. EV export volumes and regional distribution
Vehicle and EV export volumes are based on industry reports and customs data for calendar year 2025, and include China-manufactured exports (ICE, EV, and PHEV as specified). Regional distributions are approximate and reflect destination markets rather than final end-use in cases of onward resale.
The analysis does not hinge on the exact unit count for any single region. It hinges on the structural shift toward a broad, multi-regional export base rather than dependence on any single market.
6. US trade deficit and energy corridor
References to the US trade deficit (~$1.0–1.1T) reflect goods and services combined, using commonly cited BEA/Census aggregates. Bilateral shifts (for example, narrowing with China and widening with ASEAN/India) are directional and illustrative.
The discussion of the US–EU energy corridor refers to the structure of LNG exports — long-dated contracts, dollar pricing, and take-or-pay provisions — rather than short-term spot pricing. The argument concerns how these structures influence macro volatility and discount rates, not the profitability of energy producers per se.
7. Company examples (Nvidia, BYD)
Company-level figures are illustrative and based on publicly reported financials and market-cap movements over the relevant period. The comparison is intended as an intuition pump, not as proof or a comprehensive peer analysis. The framework applies equally to other firms with similar characteristics.
8. On the Trust Framework
Where the article references the Trust Framework, it points to a separate framework describing how trust is driven by credibility, reliability, intimacy and perceived self-interest over time. The argument here does not depend on prior familiarity with that framework; it draws on the same underlying logic.
9. What this article is — and is not
This article is not a valuation model, a trading recommendation, or a claim of statistical precision. It is a structural explanation of why real-world impact, economic surplus, and financial value diverge across systems, and why those divergences persist.
The thesis stands or falls on the mechanisms described — impact, translation, and multiple — not on the exact decimal point of any individual figure.
Check out some of my other Frameworks on the Fast Frameworks Substack:
May every sunset bring you peace!
Entity AI, swarms and the future of work (Asymmetric Podcast)
Fast Frameworks Podcast: Entity AI-Episode 8: Meaning, Mortality, and Machine Faith
Fast Frameworks Podcast: Entity AI - Episode 7: Living Inside the System
Fast Frameworks Podcast: Entity AI – Episode 5: The Self in the Age of Entity AI
Fast Frameworks Podcast: Entity AI – Episode 4: Risks, Rules & Revolutions
Fast Frameworks Podcast: Entity AI – Episode 3: The Builders and Their Blueprints
Fast Frameworks Podcast: Entity AI – Episode 2: The World of Entities
Fast Frameworks Podcast: Entity AI – Episode 1: The Age of Voices Has Begun
The Entity AI Framework [Part 1]
The Promotion Flywheel Framework
The Immortality Stack Framework
Frameworks for business growth
The AI implementation pyramid framework for business
A New Year Wish: eBook with consolidated Frameworks for Fulfilment
AI Giveaways Series Part 4: Meet Your AI Lawyer. Draft a contract in under a minute.
AI Giveaways Series Part 3: Create Sophisticated Presentations in Under 2 Minutes
AI Giveaways Series Part 2: Create Compelling Visuals from Text in 30 Seconds
AI Giveaways Series Part 1: Build a Website for Free in 90 Seconds
Business organisation frameworks
The delayed gratification framework for intelligent investing
The Fast Frameworks eBook+ Podcast: High-Impact Negotiation Frameworks Part 2-5
The Fast Frameworks eBook+ Podcast: High-Impact Negotiation Frameworks Part 1
Fast Frameworks: A.I. Tools - NotebookLM
The triple filter speech framework
High-Impact Negotiation Frameworks: 5/5 - pressure and unethical tactics
High-impact negotiation frameworks 4/5 - end-stage tactics
High-impact negotiation frameworks 3/5 - middle-stage tactics
High-impact negotiation frameworks 2/5 - early-stage tactics
High-impact negotiation frameworks 1/5 - Negotiating principles
Milestone 53 - reflections on completing 66% of the journey
The exponential growth framework
Fast Frameworks: A.I. Tools - Chatbots
Video: A.I. Frameworks by Aditya Sehgal
The job satisfaction framework
Fast Frameworks - A.I. Tools - Suno.AI
The Set Point Framework for Habit Change
The Plants Vs Buildings Framework
Spatial computing - a game changer with the Vision Pro
The ‘magic’ Framework for unfair advantage